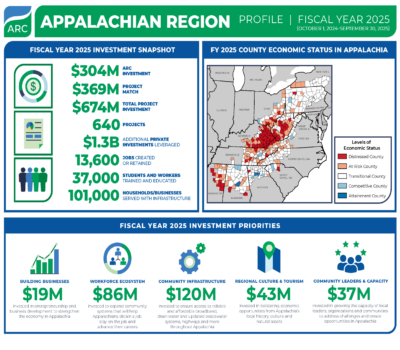
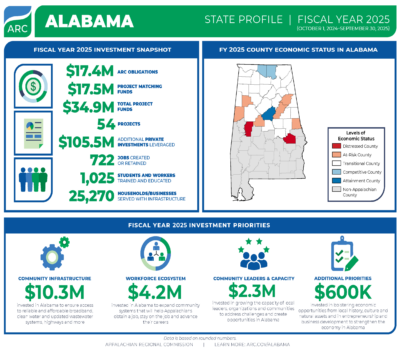
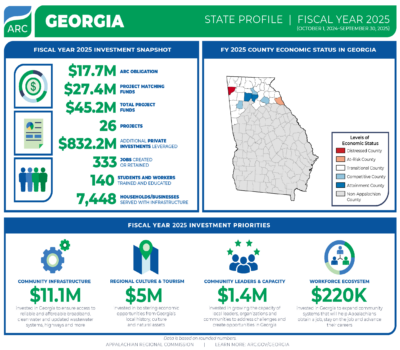
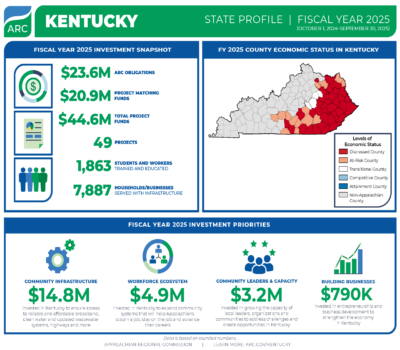
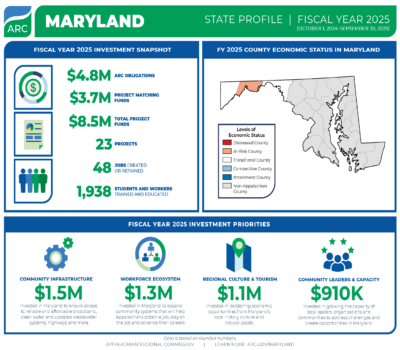
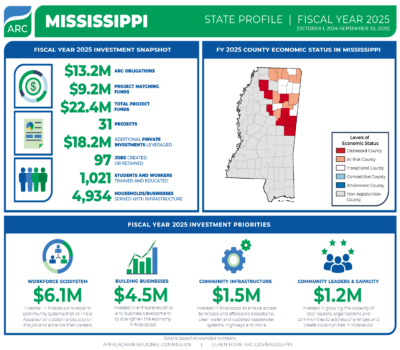
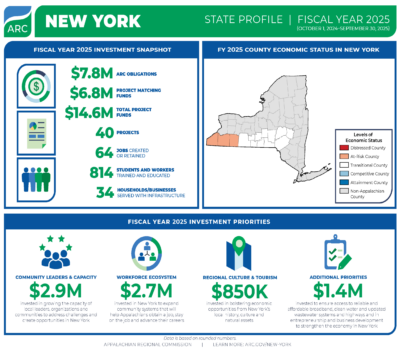
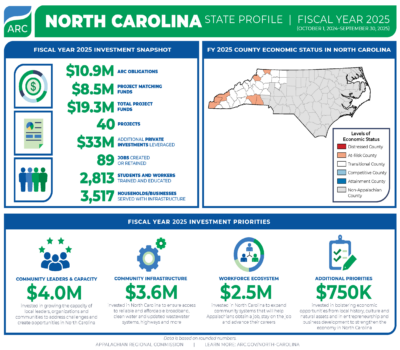
Fact Sheets and Infographics
ARC uses data from its research and evaluation reports to create fact sheets, infographics and other visuals for regional partners. This includes annual snapshots of ARC’s strategic investments in the region and data visualizations of original research.
Type
See All
Topic
See All
State
See All
Years
?
ARC's Fiscal Year runs September 30 - October 1, and is named for the calendar year in which it closes. County Economic Status maps, investment data, and budget and performance documents are categorized by Fiscal Year.
Other ARC content, including research reports, evaluations and news updates, fall into the January 1- December 31 calendar year.
See All