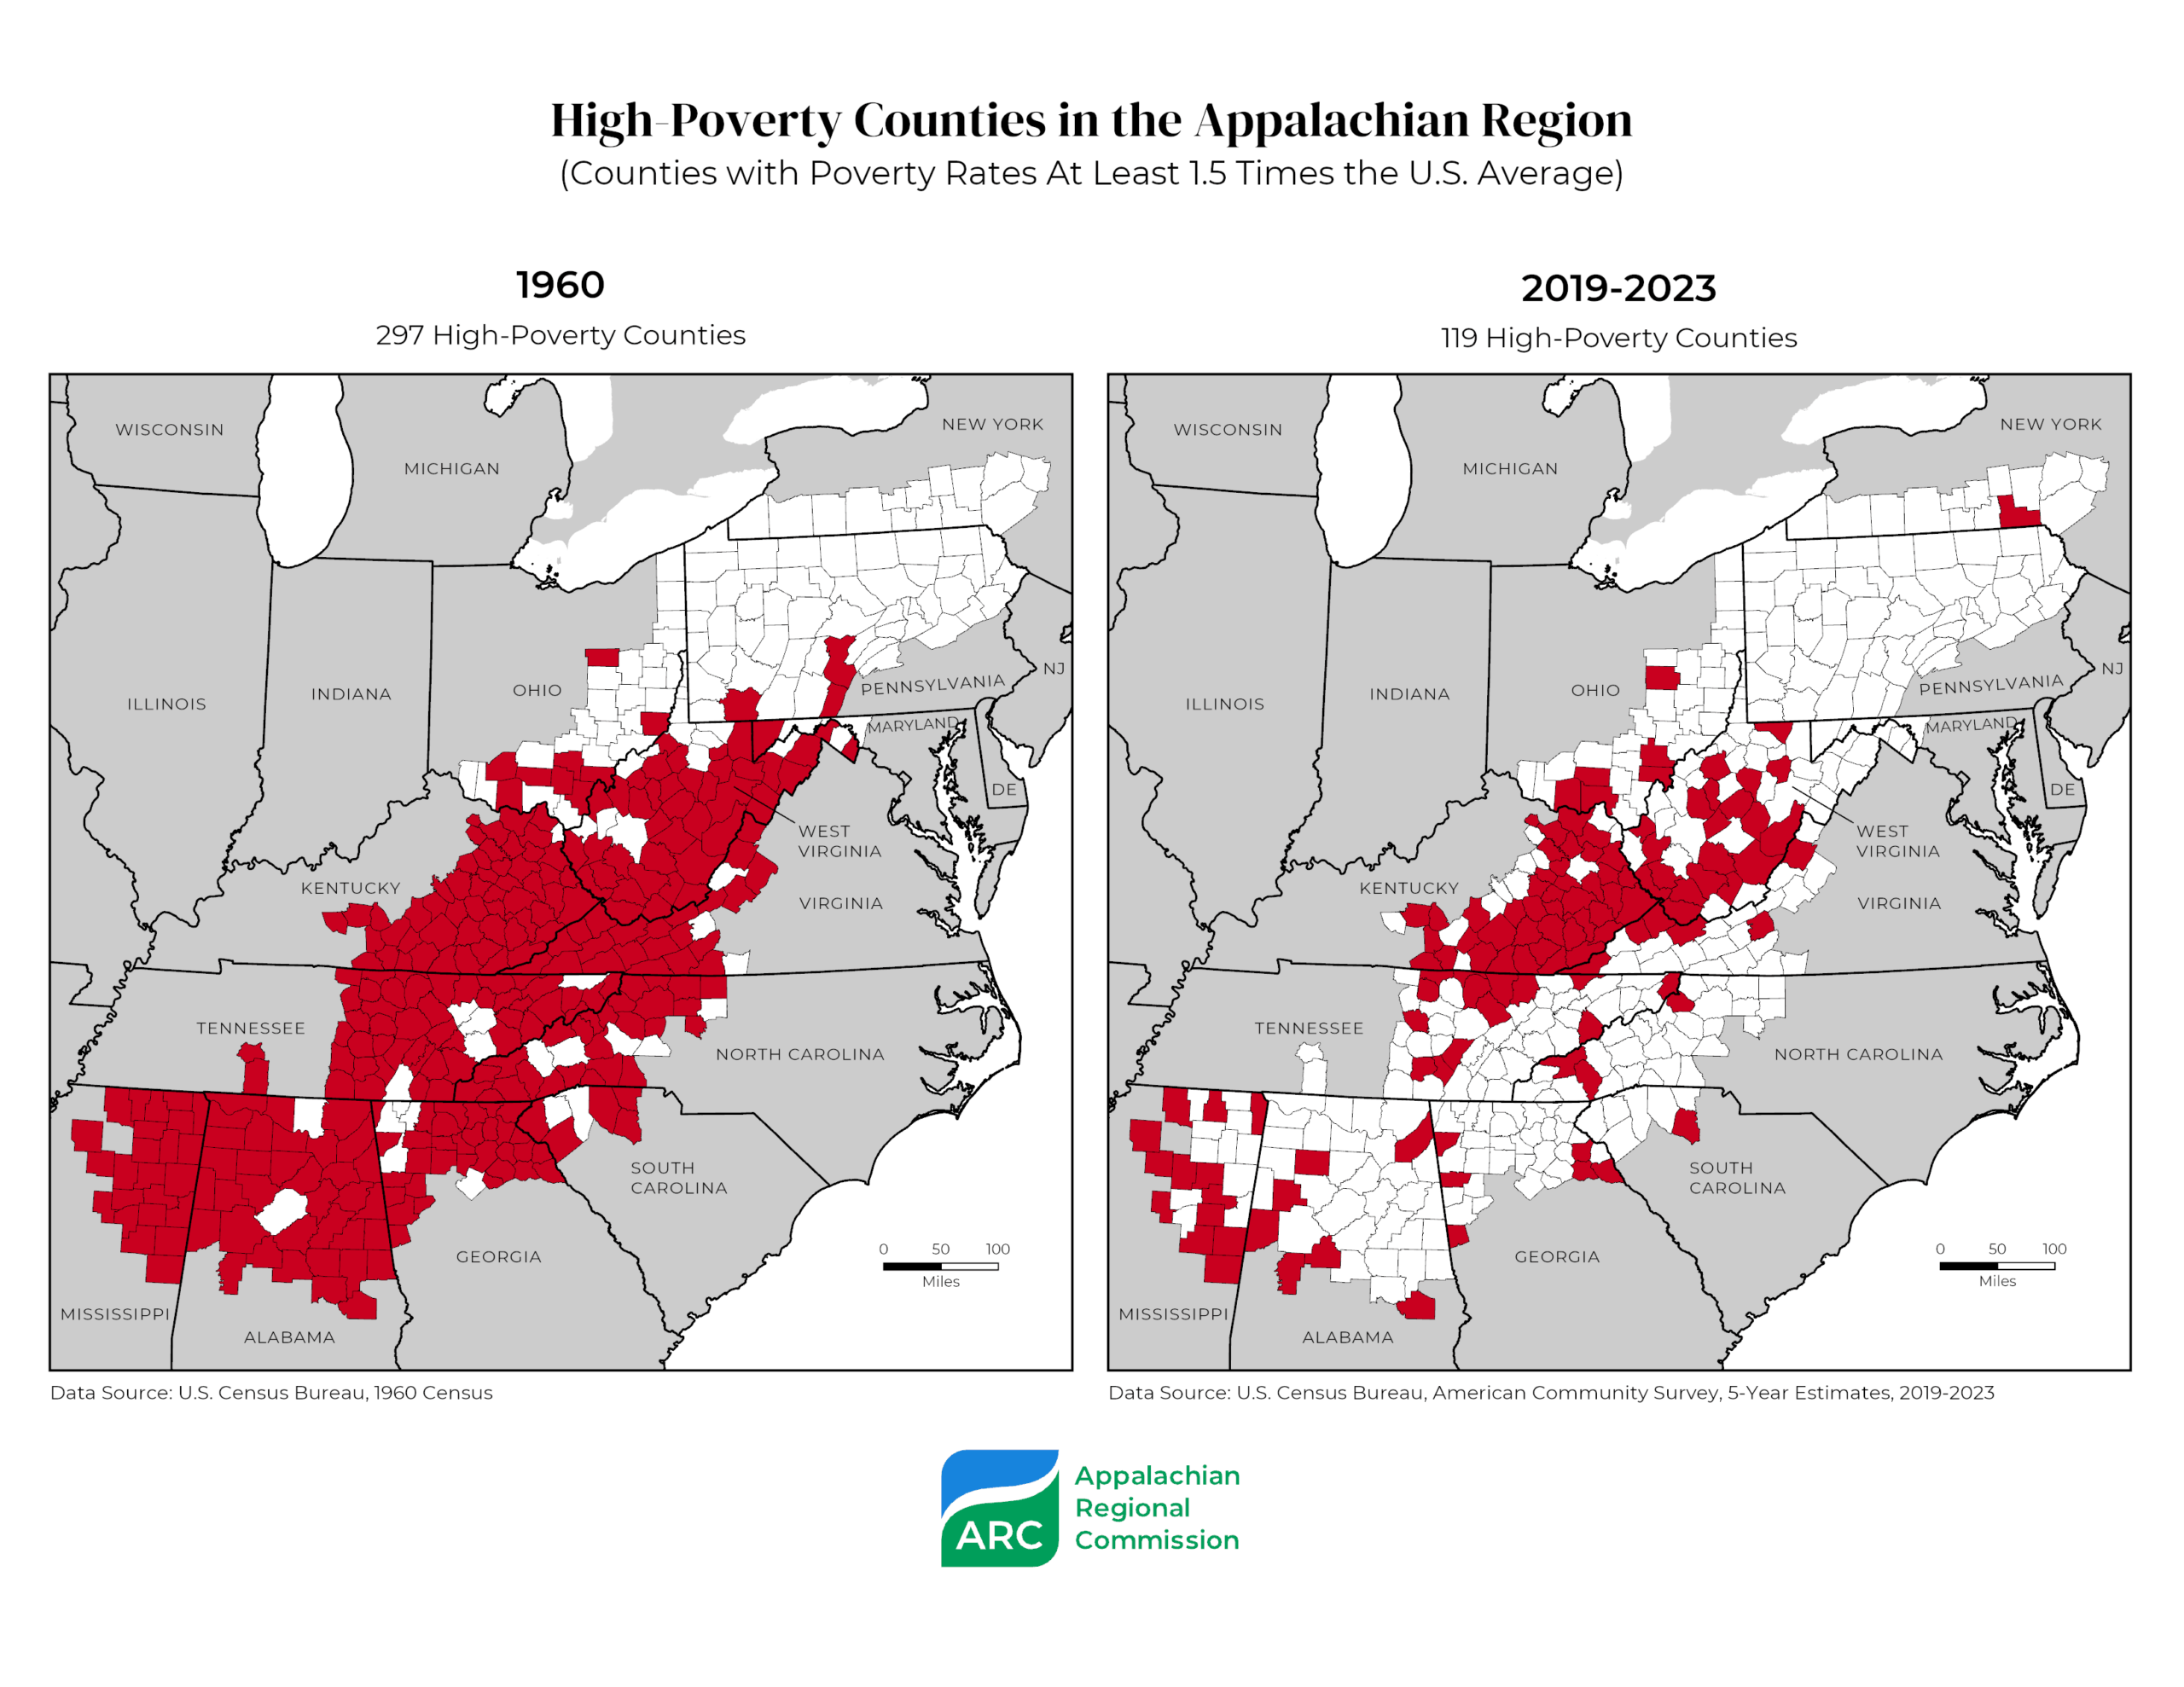
Since 1965, the Appalachian Regional Commission (ARC) has monitored the poverty rates of counties throughout Appalachia to measure their economic wellbeing and target resources to high-poverty communities with the greatest need for our investment. ARC defines high-poverty counties as those with poverty rates that are at least 1.5 times (150% or more) the national average. The number of high-poverty counties in Appalachia has been reduced by nearly 60 percent — from 297 in 1960 to 119 today.
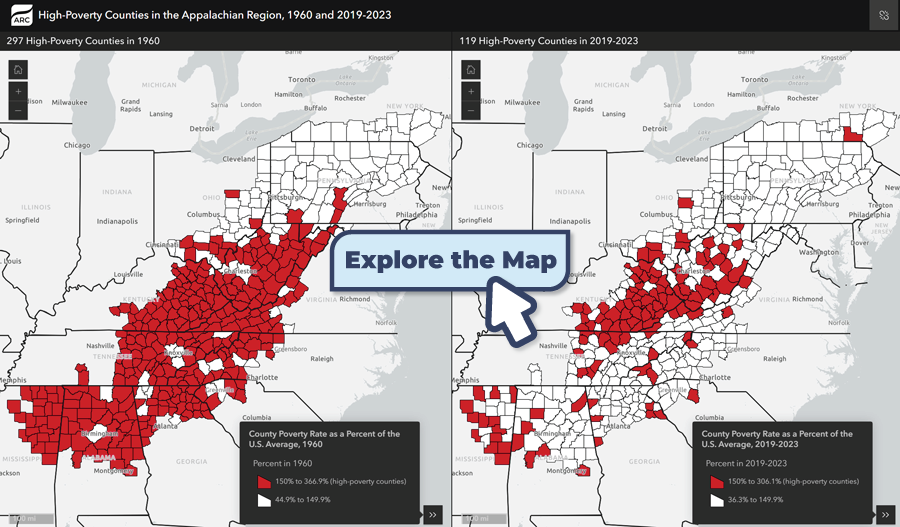
This web mapping application displays maps of high-poverty counties from the U.S. Census Bureau’s 1960 census and the most current five-year period of the American Community Survey (2019-2023). The application also provides charts that display the poverty rate for each county and the county’s rate as a percentage of the U.S. average for all decades and non-overlapping five-year periods between 1960 and today.