Access to broadband or high-speed Internet service (cable, fiber optic, DSL, cellular, or satellite) enhances people’s ability to access education, teleworking opportunities, telehealth services, community connection, entrepreneurship opportunities and more.
Between 2014-2018 and 2019-2023, the share of Appalachian households with broadband internet access and at least one computer device increased by 11.1 percentage points and 7.9 percentage points, respectively. Despite this increase, the region still lagged nearly three percentage points behind U.S. rates for both indicators.
Additionally, there are signs of a rural-urban “digital divide” within Appalachia. In 116 counties, over two-fifths of which are considered rural, less than 80% of households had a broadband subscription. In contrast, all but three of the 29 counties with subscription rates at or above the national average were in metro areas. The increased role of internet access in the aftermath of COVID-19 puts Appalachia’s rural communities at even greater risk.
Learn more about Appalachia’s broadband and device access trends below.
Broadband Subscriptions
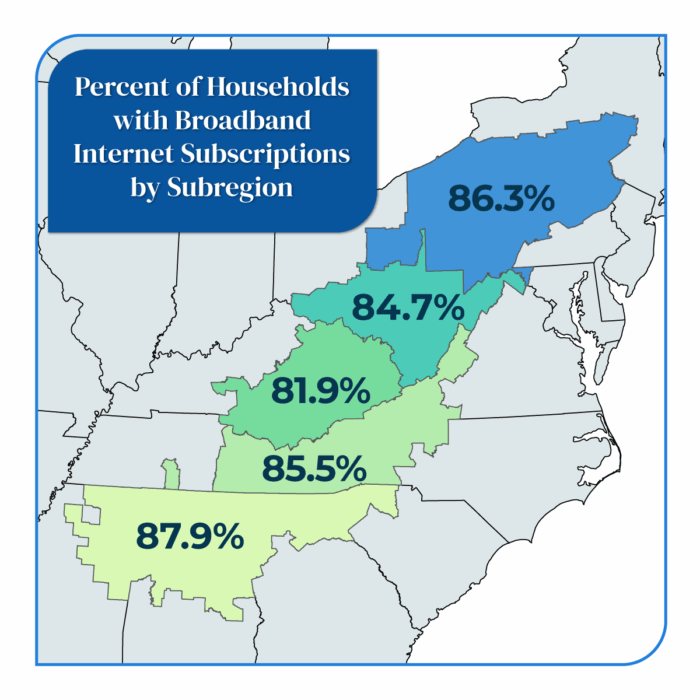
Broadband Subscriptions by Subregion
Broadband or high-speed Internet access helps people pursue learning, telework and more. During 2019-2023, 86.2% of Appalachian households had a broadband Internet subscription, compared to 89.7% nationwide. In 116 Appalachian counties, less than 80% of households had a broadband subscription.
Change in Broadband Subscriptions
Device Access in Appalachia
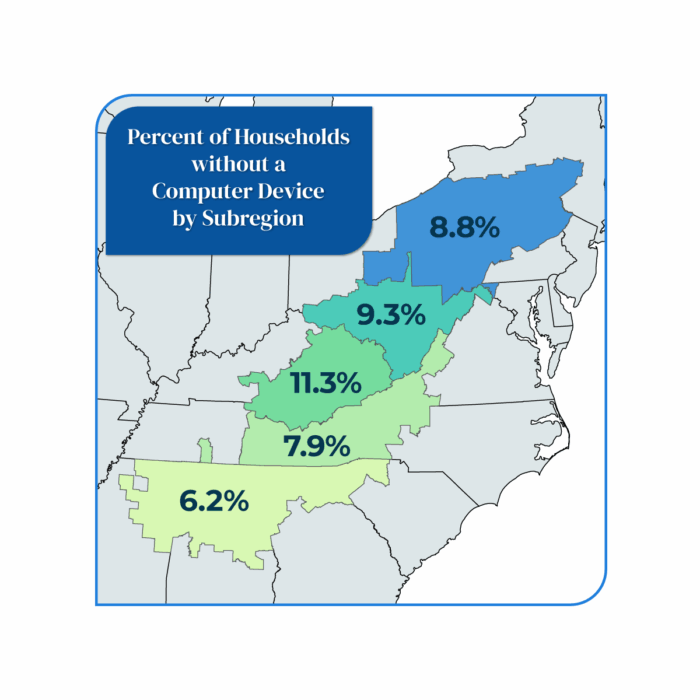
Households with No Device Access by Subregion
In the wake of COVID-19, the share of Appalachian households with at least one computer device increased by 7.9 percentage points – nearly two points more than the U.S. rate – between 2014-2018 and 2019-2023.
Despite increasing to 92% of households with a computer device, Appalachia remains nearly three points below the nation. Only 30 counties were at or above the national average; nearly half were in large metropolitan areas.
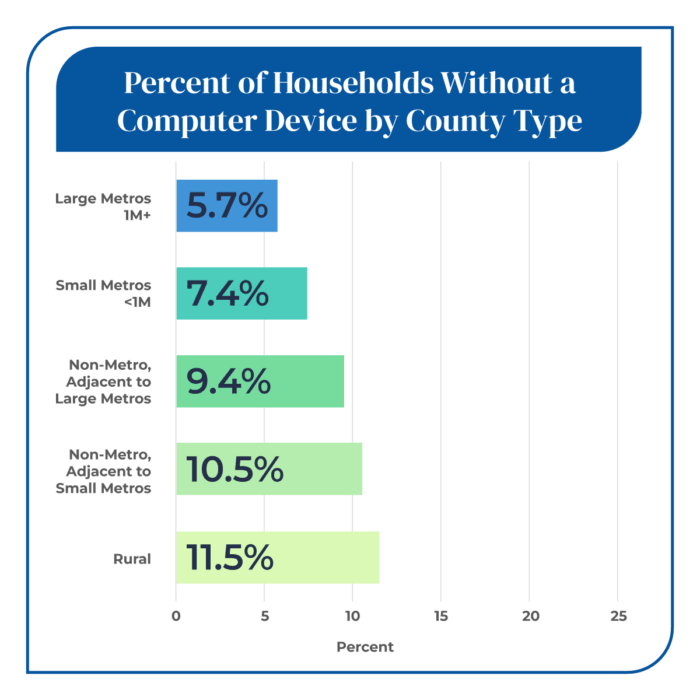
Households with No Device Access by County Type
The share of Appalachian households with a computer device was below 85% in 40 of Appalachia’s 423 counties. All but three of those counties were outside metropolitan areas, and more than two in five were in Central Appalachia. This suggests a “digital divide”—particularly between urban and rural areas in Appalachia—that will likely be more apparent in coming years.